
reports
Коллекция по умолчанию
Коллекция по умолчанию
Создать новую

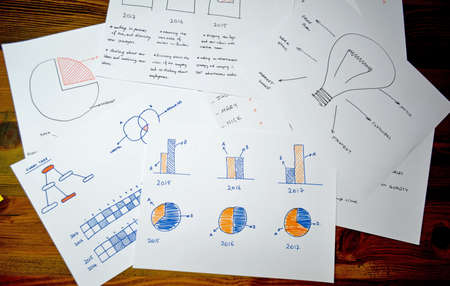
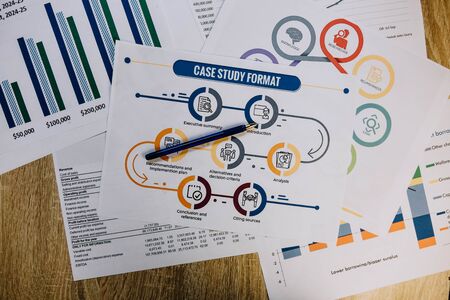
Business plan documents and charts for eco-tourism startup on rustic wooden table
Коллекция по умолчанию
Коллекция по умолчанию
Создать новую

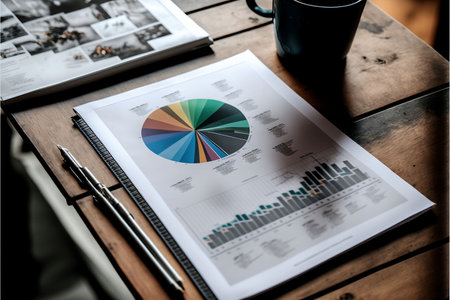
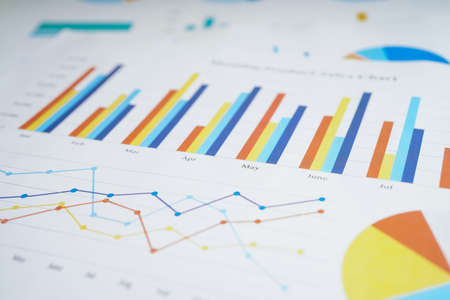
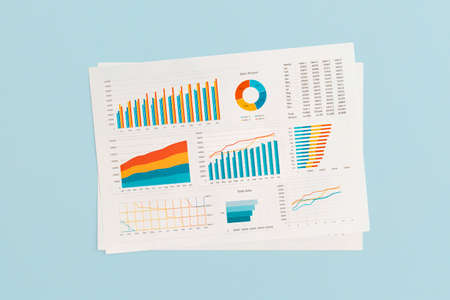
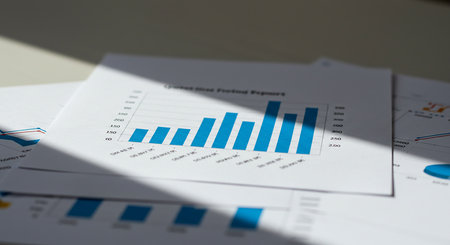
ballpoint pen indicates income graphs lying on the table
Коллекция по умолчанию
Коллекция по умолчанию
Создать новую

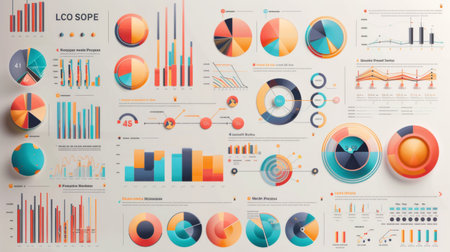
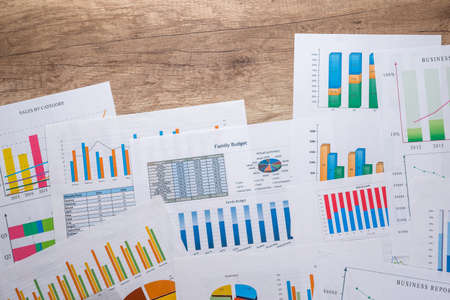
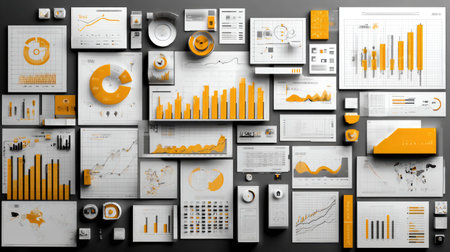
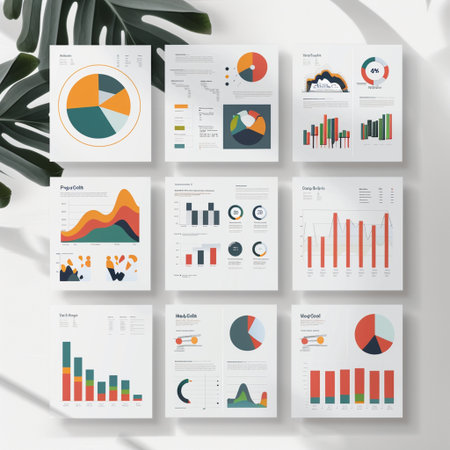
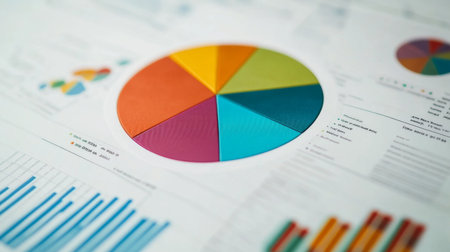
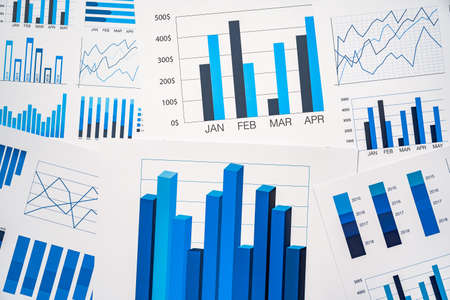
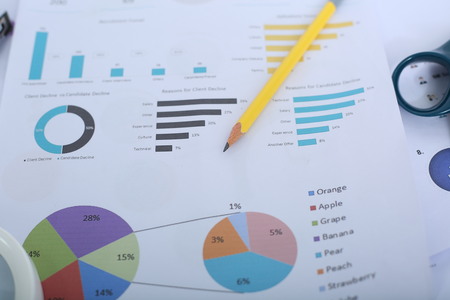
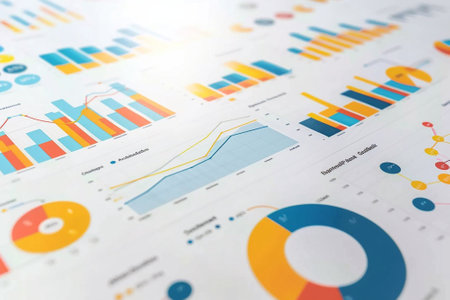
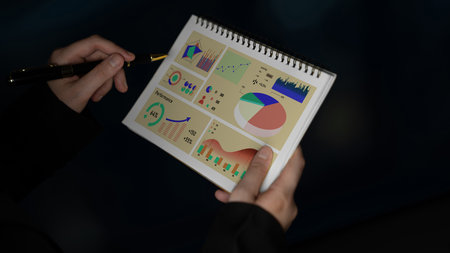
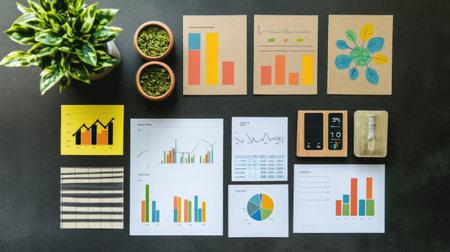
A vibrant collection of data visualization elements including colorful charts and graphs arranged on a dark surface, ideal for business analysis and presentation needs.
Коллекция по умолчанию
Коллекция по умолчанию
Создать новую

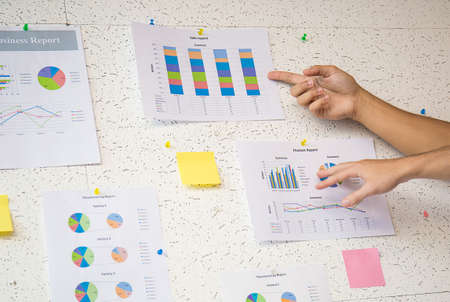
Colorful sticky notes scattered on a dark surface represent brainstorming and organization in a modern office setting, showcasing creativity and collaborative planning.
Коллекция по умолчанию
Коллекция по умолчанию
Создать новую
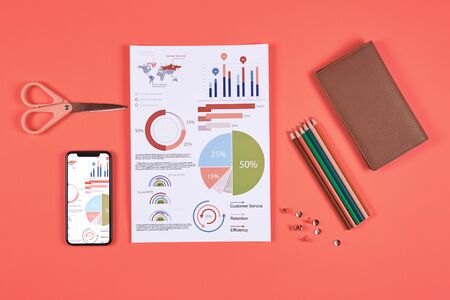
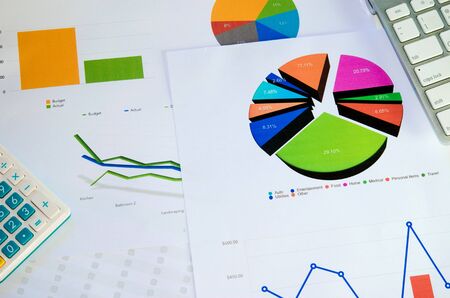
Above view flat lay of business data charts and office supplies over coral background, copy space
Коллекция по умолчанию
Коллекция по умолчанию
Создать новую

reports
Коллекция по умолчанию
Коллекция по умолчанию
Создать новую
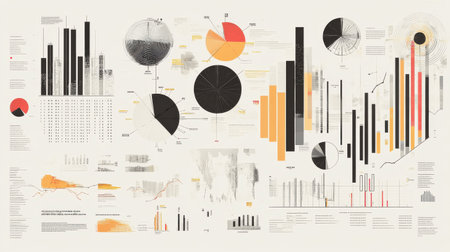
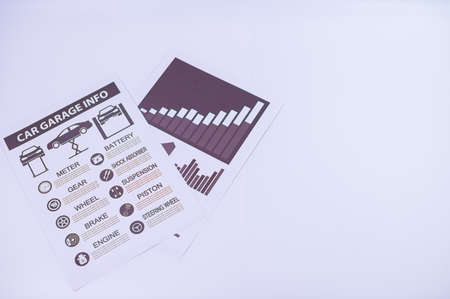
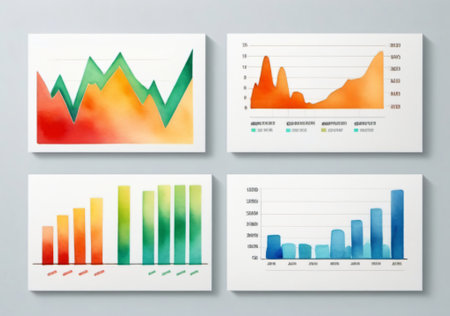
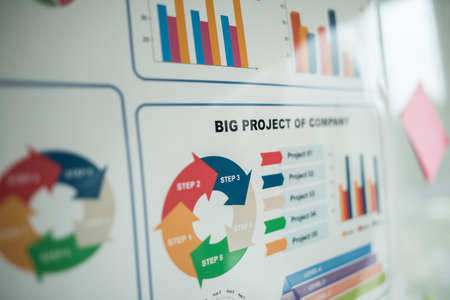
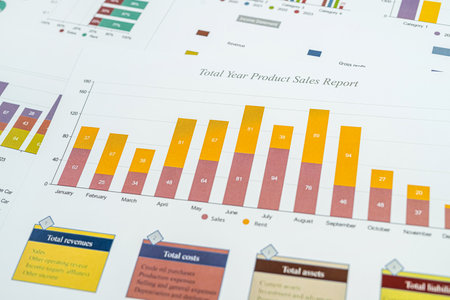
An infographic poster presenting statistical data in visually appealing graphs and illustrations for easy understanding.
Коллекция по умолчанию
Коллекция по умолчанию
Создать новую
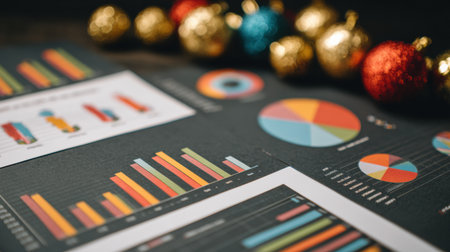
Charts and graphs display data insights on a table, while vibrant holiday ornaments add a festive touch to the workspace, creating a cheerful atmosphere.
Коллекция по умолчанию
Коллекция по умолчанию
Создать новую

Many type of infographic diagram over white background. Top view.
Коллекция по умолчанию
Коллекция по умолчанию
Создать новую

business analysis and statistics concept, desk with mixed graphs and charts on clipboard
Коллекция по умолчанию
Коллекция по умолчанию
Создать новую

Colored sticker stripes on business analytics chart closeup
Коллекция по умолчанию
Коллекция по умолчанию
Создать новую
Digital cyberspace with data analysis process, high tech concept. Animation. Blocks of endlessly written program code, seamless loop.
Коллекция по умолчанию
Коллекция по умолчанию
Создать новую
Financial paper with charts and diagrams on gray table
Коллекция по умолчанию
Коллекция по умолчанию
Создать новую
Businessman hand holding a document. Scenes white background.
Коллекция по умолчанию
Коллекция по умолчанию
Создать новую

Radiated emissions spectrogram with limit lines in EMC electromagnetic compatibility test report
Коллекция по умолчанию
Коллекция по умолчанию
Создать новую
Different business graph charts on pink sticky notes for business planning and analysis
Коллекция по умолчанию
Коллекция по умолчанию
Создать новую
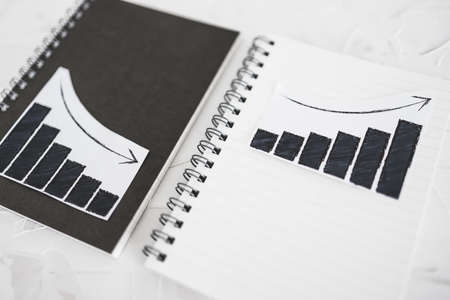
business analysis and statistics concept, positive and negative trends on graphs on notebooks side by side
Коллекция по умолчанию
Коллекция по умолчанию
Создать новую
Modern infographics options banner. Use for workflow layout, diagram, annual report, web design.
Коллекция по умолчанию
Коллекция по умолчанию
Создать новую

Shallow depth of field (selective focus) with details of a chart showing the stock market crash from March 2020 due to the Covid-19 pandemic on a computer screen (S&P500 index)
Коллекция по умолчанию
Коллекция по умолчанию
Создать новую
Financial data is analyzed using an array of visual elements, including bar graphs and pie charts, showing performance metrics and market trends in a clear layout.
Коллекция по умолчанию
Коллекция по умолчанию
Создать новую

A visually engaging workspace featuring colorful push pins and sticky notes on graph paper, illustrating data representation and enhancing creative organization for projects.
Коллекция по умолчанию
Коллекция по умолчанию
Создать новую

A vibrant bar chart displayed on a dark surface, showcasing data analysis and statistical trends, ideal for business presentations and reports.
Коллекция по умолчанию
Коллекция по умолчанию
Создать новую
many different business graph with calculator and pen on desk.
Коллекция по умолчанию
Коллекция по умолчанию
Создать новую

business analysis and statistics concept, desk with mixed graphs and charts on clipboard
Коллекция по умолчанию
Коллекция по умолчанию
Создать новую

Close-up of a stock market analysis chart with a mix of bar graphs and line graphs highlighting key data
Коллекция по умолчанию
Коллекция по умолчанию
Создать новую

Annual business report. Accountability paperwork. Hands holding a heap of documents with graphs and statistics
Коллекция по умолчанию
Коллекция по умолчанию
Создать новую
An AI generated illustration of project management graphs charts paper
Коллекция по умолчанию
Коллекция по умолчанию
Создать новую
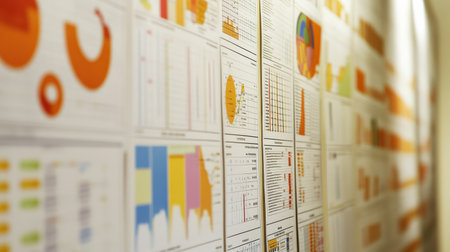
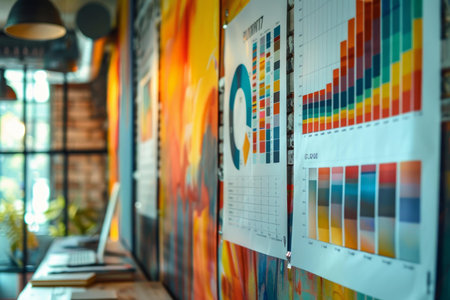
Various colorful charts and graphs are mounted on a wall in an office. These visual data representations highlight trends and metrics used for analysis, providing insights for decision making.
Коллекция по умолчанию
Коллекция по умолчанию
Создать новую
Business document paper placed on a white scene
Коллекция по умолчанию
Коллекция по умолчанию
Создать новую

Charts Graphs paper. Financial development, Banking Account, Statistics, Investment Analytic research data economy, Stock exchange Business office company meeting concept.
Коллекция по умолчанию
Коллекция по умолчанию
Создать новую
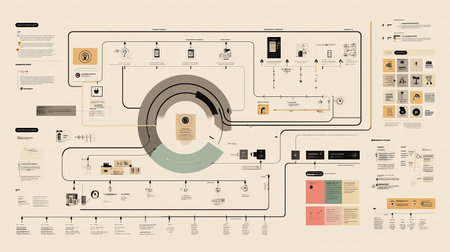
A timeline chart showing events and milestones over time AI generated
Коллекция по умолчанию
Коллекция по умолчанию
Создать новую

Graph of market share with black pen in business concept
Коллекция по умолчанию
Коллекция по умолчанию
Создать новую

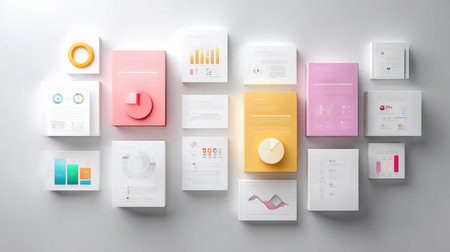
This image features a vibrant assortment of 3D shapes and colorful data visualization elements, ideal for enhancing reports and presentations.
Коллекция по умолчанию
Коллекция по умолчанию
Создать новую

Analysis of data from graphs. select focus.
Коллекция по умолчанию
Коллекция по умолчанию
Создать новую
Discover a vibrant collection of data visualization elements featuring graphs, charts, and diagrams in orange and white, perfect for business analytics and professional reports.
Коллекция по умолчанию
Коллекция по умолчанию
Создать новую
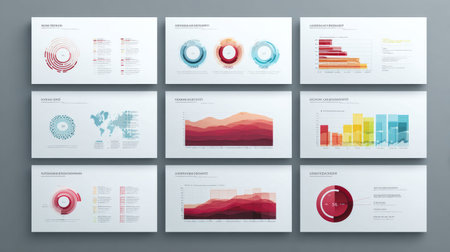
Collection of modern data visualizations featuring various charts and graphs ideal for enhancing business presentations and delivering key insights effectively.
Коллекция по умолчанию
Коллекция по умолчанию
Создать новую
Charts Graphs paper. Financial development, Banking Account, Statistics, Investment Analytic research data economy, Stock exchange Business office company meeting concept.
Коллекция по умолчанию
Коллекция по умолчанию
Создать новую

Wooden Blocks Connected in a Network Showing Various Technology Icons, generative Ai
Коллекция по умолчанию
Коллекция по умолчанию
Создать новую

Flat lay of product development timeline and startup vision pages
Коллекция по умолчанию
Коллекция по умолчанию
Создать новую
many sheets of documentation lying on the table.
Коллекция по умолчанию
Коллекция по умолчанию
Создать новую
A vibrant and modern composition featuring various data visualizations, including charts and graphs, ideal for business presentations and strategic planning.
Коллекция по умолчанию
Коллекция по умолчанию
Создать новую
Set of infographic elements for business data visualization. Template for presentation.
Коллекция по умолчанию
Коллекция по умолчанию
Создать новую
Business graphs and charts on table. Financial development, Banking Account, Statistics
Коллекция по умолчанию
Коллекция по умолчанию
Создать новую

Team work with results and reports
Коллекция по умолчанию
Коллекция по умолчанию
Создать новую

A white board with lots of drawings and notes on it. The drawings are of various shapes and sizes, and the notes are written in different colors
Коллекция по умолчанию
Коллекция по умолчанию
Создать новую

marketing distribution channels plan on office desk
Коллекция по умолчанию
Коллекция по умолчанию
Создать новую

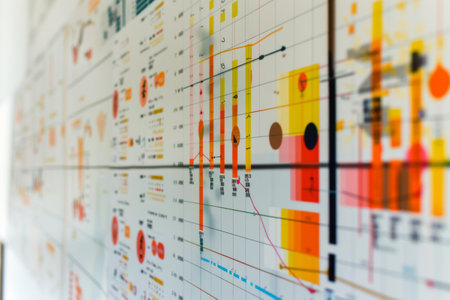
A collection of medical graphs and charts displayed on a clinic wall depicting various data readings. This image captures the essence of data-driven healthcare analysis.
Коллекция по умолчанию
Коллекция по умолчанию
Создать новую

business graph with pen
Коллекция по умолчанию
Коллекция по умолчанию
Создать новую
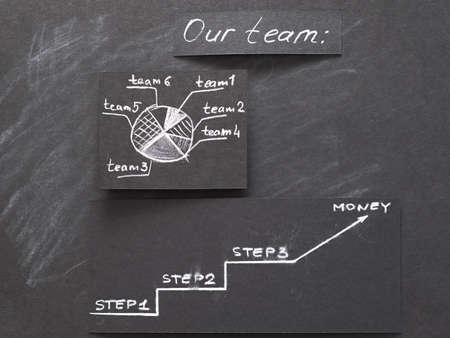
pie graph with segments and steps to earning money. teamwork company strategy. diagram on black chalkboard.
Коллекция по умолчанию
Коллекция по умолчанию
Создать новую
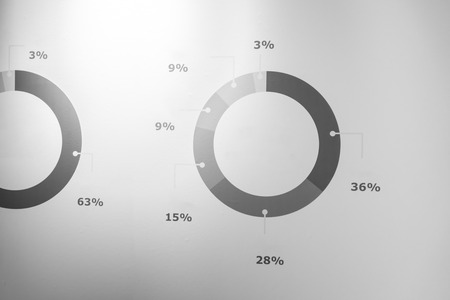
A colorful financial pie chart showing market shares, with labeled sections representing stocks, bonds, and investments, displayed on a white background with clean lines.
Коллекция по умолчанию
Коллекция по умолчанию
Создать новую

This image showcases an abstract representation of a network, featuring colorful tokens on a technical blueprint. It highlights connections, interactions, and design elements.
Коллекция по умолчанию
Коллекция по умолчанию
Создать новую

Financial reports and charts on a office meeting office
Коллекция по умолчанию
Коллекция по умолчанию
Создать новую
Businessman hand holding a document. Scenes white background.
Коллекция по умолчанию
Коллекция по умолчанию
Создать новую
Set of business card templates with colorful graphs and charts. Vector illustration.
Коллекция по умолчанию
Коллекция по умолчанию
Создать новую
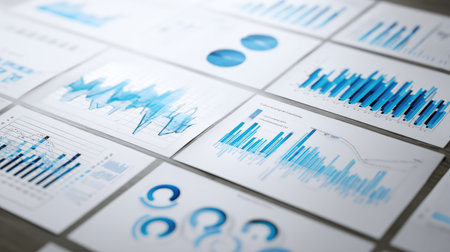
Explore an aerial view of detailed analytical reports showcasing various graphs and charts in blue tones, arranged on a wooden surface for business insights.
Коллекция по умолчанию
Коллекция по умолчанию
Создать новую
20 and 50 euro banknotes and wallet and cigar on wood background
Коллекция по умолчанию
Коллекция по умолчанию
Создать новую
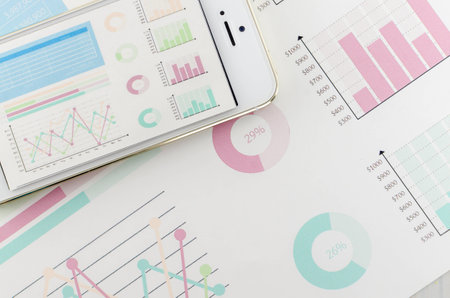
Graphs and phone
Коллекция по умолчанию
Коллекция по умолчанию
Создать новую

A white board with many drawings and ideas on it. Scene is creative and innovative
Коллекция по умолчанию
Коллекция по умолчанию
Создать новую
An office worker shows his colleagues a presentation with a company development graph at night on the company's computer
Коллекция по умолчанию
Коллекция по умолчанию
Создать новую

Sales profit numbers changing on monitor after global trade, real time exchange market stocks statistics growing. Financial graphs showing money trend, risk buying. Close up. Tripod shot.
Коллекция по умолчанию
Коллекция по умолчанию
Создать новую
Monthly percentage bar chart showing financial comparison of 2026 budget versus actual performance data displayed on digital screen. Results tracking.
Коллекция по умолчанию
Коллекция по умолчанию
Создать новую
Business reports
Коллекция по умолчанию
Коллекция по умолчанию
Создать новую
Diagram showing the structure of a molecular structure of Sulfur dioxide.
Коллекция по умолчанию
Коллекция по умолчанию
Создать новую
Financial paper with charts and diagrams on gray table
Коллекция по умолчанию
Коллекция по умолчанию
Создать новую

Business financial or stock market background. Business graph on stock market financial exchange
Коллекция по умолчанию
Коллекция по умолчанию
Создать новую

A detailed diagram illustrates project management strategies with colorful nodes and connections, symbolizing teamwork and effective planning in a business environment.
Коллекция по умолчанию
Коллекция по умолчанию
Создать новую

A close-up of a mind map drawn on a whiteboard, with colorful branches representing different concepts and connections, capturing the process of brainstorming.
Коллекция по умолчанию
Коллекция по умолчанию
Создать новую
Graph document on a black table
Коллекция по умолчанию
Коллекция по умолчанию
Создать новую
business documents over papers with numbers and charts. View from above
Коллекция по умолчанию
Коллекция по умолчанию
Создать новую

Online stock exchange application with information on screen, closeup
Коллекция по умолчанию
Коллекция по умолчанию
Создать новую

reports and histograms on paper on the table in the hands of a girl, analytics and statistics on paper, business analytics
Коллекция по умолчанию
Коллекция по умолчанию
Создать новую
Picture of pencil on the financial office paper.
Коллекция по умолчанию
Коллекция по умолчанию
Создать новую

image of the financial graph on a computer monitor.
Коллекция по умолчанию
Коллекция по умолчанию
Создать новую
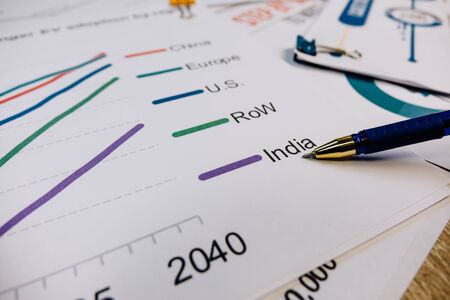
the pen points to the chart layer with the word India.
Коллекция по умолчанию
Коллекция по умолчанию
Создать новую
Multi exposure of abstract graphic coding sketch on a modern furnished classroom background, big data and networking concept
Коллекция по умолчанию
Коллекция по умолчанию
Создать новую
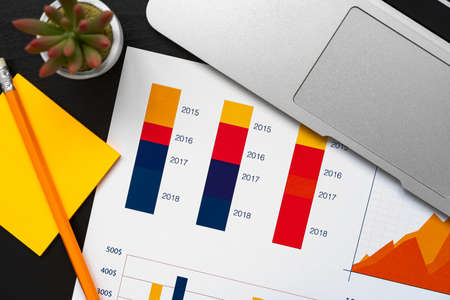
Printed graphs and laptop on dark gray surface
Коллекция по умолчанию
Коллекция по умолчанию
Создать новую
documents on office table with laptop computer and graph financial with social network diagram - Filter vintage
Коллекция по умолчанию
Коллекция по умолчанию
Создать новую
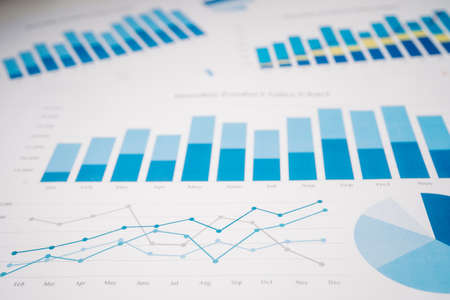
Chart graph paper. Financial development, Banking Account, Statistics, Investment Analytic research data economy, trading, Business company concept.
Коллекция по умолчанию
Коллекция по умолчанию
Создать новую
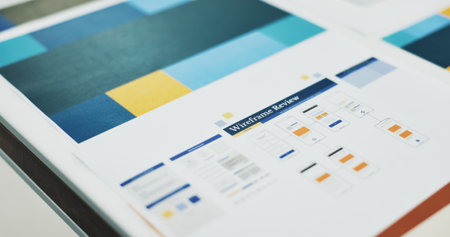
Documents, wireframe chart and review in empty office, startup and ux design with icon at company. Paperwork, graph and connection with flowchart, mobile app ui and development for user experience
Коллекция по умолчанию
Коллекция по умолчанию
Создать новую
Color palettes and data analysis being presented on a wall in a creative agency
Коллекция по умолчанию
Коллекция по умолчанию
Создать новую
Vector illustration depicting detailed data graph analysis in a business context against a clean white background. Perfect for presentations, reports, and infographics, artwork provides a visually appealing representation of business analytics.
Коллекция по умолчанию
Коллекция по умолчанию
Создать новую
Finance and accounting business, business planing, accounting
Коллекция по умолчанию
Коллекция по умолчанию
Создать новую
financial charts and graphs on the table of the businessman, business concept
Коллекция по умолчанию
Коллекция по умолчанию
Создать новую

businessman hand working on wooden desk in office and there are many documents, graphs. Can be attributed to financial articles.
Коллекция по умолчанию
Коллекция по умолчанию
Создать новую

A vibrant display of pastel color swatches arranged on a light background, ideal for exploring color combinations and creative design concepts. Perfect for artists and designers.
Коллекция по умолчанию
Коллекция по умолчанию
Создать новую

Close up image of a flowchart showing various steps of a process, representing workflow, stages, and methodology.
Коллекция по умолчанию
Коллекция по умолчанию
Создать новую
A person holds a notepad filled with colorful graphs and charts, ideal for illustrating data analysis trends and insights for business or research.
Коллекция по умолчанию
Коллекция по умолчанию
Создать новую

Close up image of a flowchart showing various steps of a process, representing workflow, stages, and methodology.
Коллекция по умолчанию
Коллекция по умолчанию
Создать новую
Hands pointing to strategy on the wall
Коллекция по умолчанию
Коллекция по умолчанию
Создать новую
A visually engaging workspace featuring colorful charts and graphs alongside planters, ideal for presentations, data analysis, and professional brainstorming sessions.
Коллекция по умолчанию
Коллекция по умолчанию
Создать новую

pie graph with segments. teamwork cooperation and labor division and work delegation. diagram on black chalkboard.
Коллекция по умолчанию
Коллекция по умолчанию
Создать новую
Graphic and circle diagram on white wall. Business info graphic interface design concept.
Коллекция по умолчанию
Коллекция по умолчанию
Создать новую
Many business reports. financial data of the company. paperwork concept
Коллекция по умолчанию
Коллекция по умолчанию
Создать новую
Graphs
Коллекция по умолчанию
Коллекция по умолчанию
Создать новую

A vibrant digital composition illustrates an advanced online learning platform featuring graphs, charts, and interactive elements in a colorful design. Students engage with modern educational tools.
Коллекция по умолчанию
Коллекция по умолчанию
Создать новую

Virus pandemic covid-19 map on pc screen, global infection, internet.
Коллекция по умолчанию
Коллекция по умолчанию
Создать новую

Zoomed in on a screen showing a colorcoded timeline that visualizes shifts in consumer demand overlaid with alerts for immediate adjustments to production schedules
Коллекция по умолчанию
Коллекция по умолчанию
Создать новую
A colorful chart with many different colored bars and lines. The chart is titled Trends in the Stock Market
Коллекция по умолчанию
Коллекция по умолчанию
Создать новую
Woman holding business reports
Коллекция по умолчанию
Коллекция по умолчанию
Создать новую
Legion-Media
Создайте свои проекты на основе качественных стоковых фотографий и видео.


Copyright © Legion-Media.